Unveiling Design Rights Down Under: Insights from the 2024 IP Report
By Samantha Ludemann | Associate
To further our earlier article, Trade Mark Applications Continue to Add Value to Australian Businesses: IP Australia Report 2024, the following piece will explore the growing field of registered design rights in Australia.
Design rights protect a product’s visual appearance, giving owners an exclusive right to use, make, sell, or license the design in Australia.
The 2024 IP Australia Report revealed a significant milestone related to design applications in 2023. It marked the highest number of design applications to date. Compared to 2022, there was an 11.5% increase, totalling 8,776 applications overall. This substantial increase in application filings suggests a heightened recognition among businesses and individuals of the value and competitive edge of obtaining a registered design right.
Out of these 8,776 applications, 8,000 advanced to registration. IP Australia also certified a significant number of design applications, specifically 1,540 designs, an increase (24.1%) compared to the previous year. This increase was evident across both resident and non-resident certifications, with respective jumps of 25.3% (totalling 520 certifications) and 23.4% (totalling 1,019 certifications).
For further insights into the distinctions between registering and certifying design applications, and to learn more about design rights generally, see our informative Tik Tok.
Resident applications grew in 2023 by 24.2% from 2022. This is the first increase since 2018 and totals 2,652 applications. A contrast to the 17.9% decline observed in resident filings in 2022, indicating a significant turnaround from the previous downward trend. These developments underscore a resurgence of competitiveness among local innovators within Australia’s IP landscape.
Staying on home soil but turning our attention to international stakeholders, non-resident applications did not depart from the upward trends or record-breaking and reached a record high of 6,189. Before the COVID pandemic, these numbers were trending downward. However, this upward trend has been recorded for three years running.
Filings from the United States comprise a high number of the 2023 design applications, totalling 2,097 filings. However, a big driver behind the growth in design applications is attributable to applications originating from China, with a 10.5% increase in filing compared to 2022, with 946 applications in total. Notable mentions go to the Netherlands with 426 applications, Switzerland with 367 applications, and the United Kingdom with 300 applications.
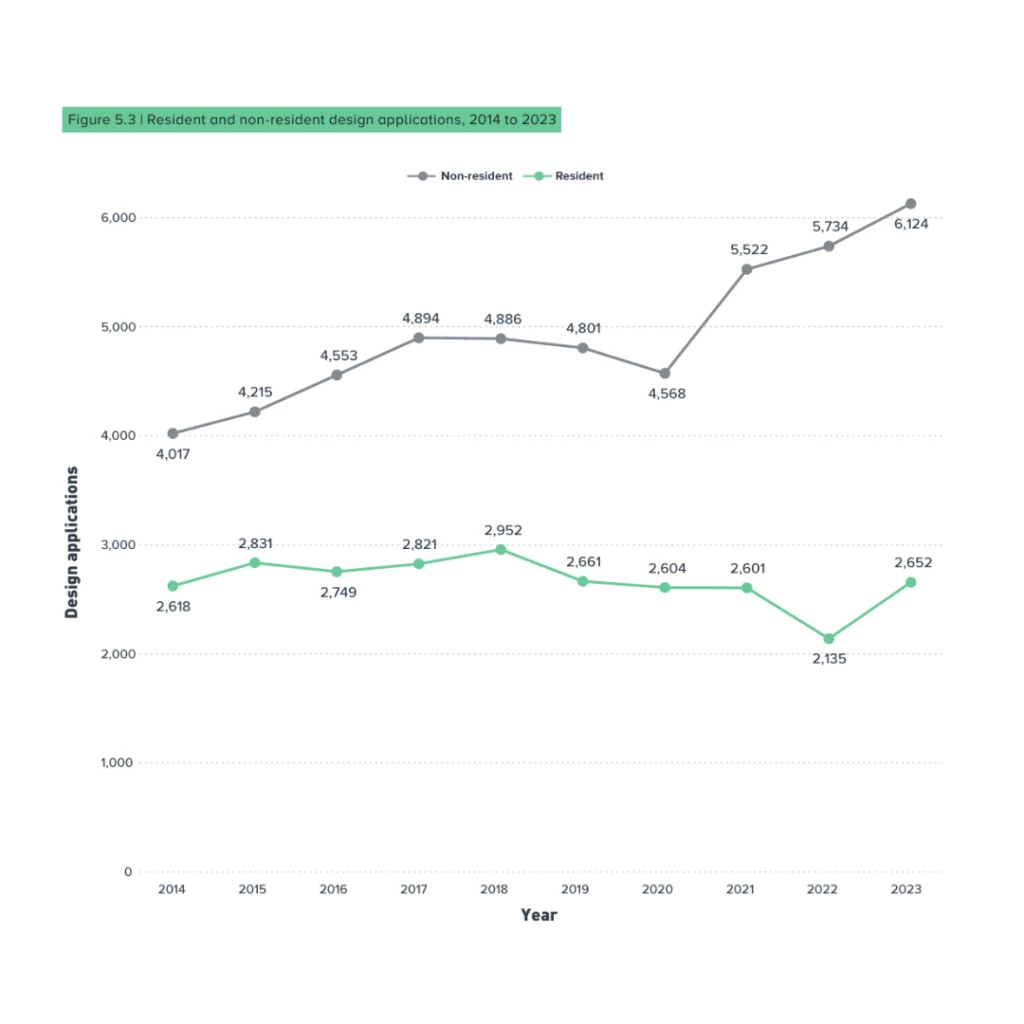
Retrieved from Australian Intellectual Property Report 2024¹.
The lead domestic filers include only one familiar face, Schneider Electric Australia, at number 4; the rest are completely fresh to the scene, signalling a shifting landscape where emerging entities are making significant strides in the intellectual property sphere. These newcomers include Cube in Cube Design & Drafting (48 applications), Systems Ip (42 applications) and Andrew Plim (32 applications).
As with the domestic top filer, the leading international filer is a newcomer. VidaX, a Netherlands based company, filed an impressive 268 applications. However, the top international filers include a few familiar names, such as Apple, Cartier, and Sony Interactive Entertainment.
Looking at filings by Australians abroad, there was not the same eagerness to protect design rights overseas as there was at home, with a 12.5% decrease overall in international filings from 2021. The only country where applications by Australians increased was China, whereas filings in the United States, European Union, United Kingdom, and New Zealand all saw a decline in design applications.
The classes for designs are made up of 32 categories in total. Predictably, the foremost category for design filings was recording, telecommunications, or data processing equipment, with a total of 1,017 filings proving the ongoing importance and innovation within the technology and electronics sectors. On the unexpected side was the class with the strongest growth in 2023: building units and construction elements saw a remarkable increase of 53.2%, totalling 579 design filings, in contrast to the declining trend previously seen in this class. Reflecting the revenue growth anticipated in the industry over the coming years.²
In line with the trade mark filing numbers, small and medium enterprises (SMEs) and individuals make up a good proportion of the design filings made by residents, being 68.7% and 23.5%, respectively, reflecting the active participation of SMEs and independent creators in seeking design protections. Just as international studies indicate that patents and trade marks “increase investors’ estimates of a startup’s value by around 20%”³, at XVII Degrees we are of the view that the same testament can be applied to registered design rights.
Those seeking to navigate design applications with confident guidance contact XVII Degrees. We are committed to offering expert support to help you successfully secure and protect your designs.
Sources:
[1] IP Australia. 2024. Figure 5.3 | Resident and non-resident design applications, 2014 to 2023. Page 65.
[2] IP Australia. 2024. Australia Intellectual Property Report 2024. Page 64.
[3] IP Australia. 2024. Intellectual Property Report 2024. Page 10. Citing Hsu & Ziedonis, 2013.